WDI 2022: Development and Health Patterns

Lucas Huang

2026-02-26

Title slide

World Development Indicators (WDI), 2022
Key relationships among GDP per capita, life expectancy, and inequality.

(World Bank 2026)

Dataset & indicators

We analyze 2022 WDI indicators for multiple countries:

  • GDP per capita (gdp_per_capita)
  • Life expectancy (life_expectancy)
  • Total population (total_population)
  • Income inequality (income_inequality)
  • Unemployment and inflation (context variables)

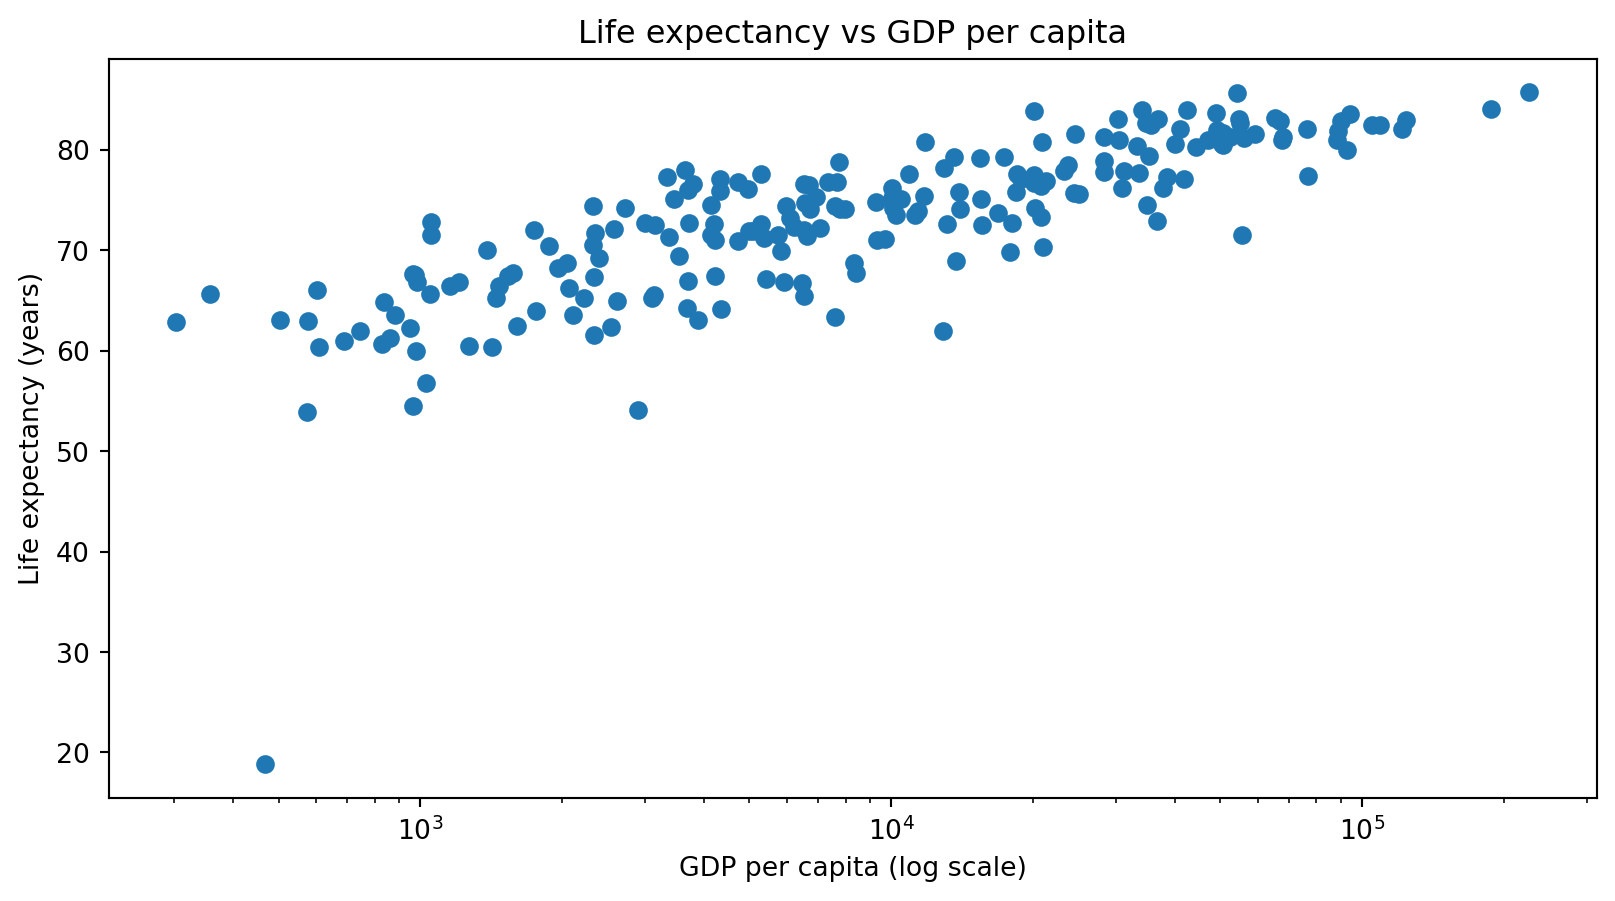
Relationship: Life expectancy vs GDP per capita

Figure 1: Life expectancy vs GDP per capita (log scale).

This pattern resembles the classic Preston curve: gains in income predict larger improvements at lower income levels (Preston 1975).

Relationship: Inequality vs life expectancy

Figure 2: Life expectancy vs income inequality.

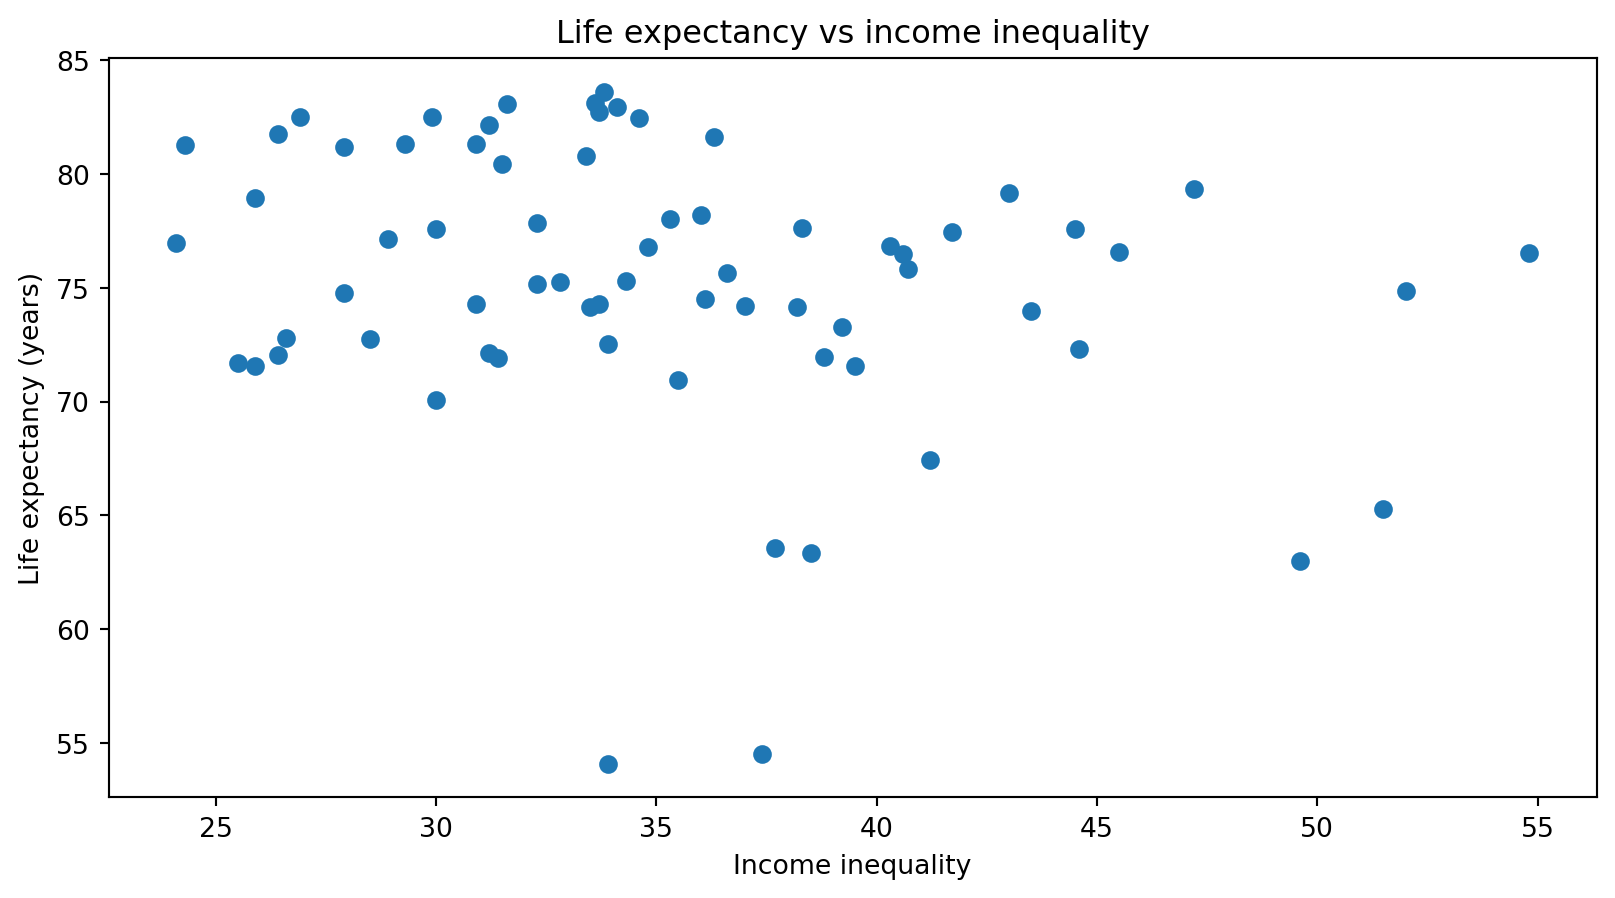
Interpretation: briefly describe the direction/strength and any outliers you noticed.

Summary table (key stats)

Table 1: Summary statistics (rounded to two decimals).
count mean median min max
life_expectancy 217.0 73.11 74.16 18.82 8.575000e+01
gdp_per_capita 209.0 21142.75 7655.59 302.99 2.260520e+05
total_population 217.0 36711331.52 6664449.00 9992.00 1.425423e+09
unemployment_rate 186.0 7.20 5.34 0.13 3.647000e+01
inflation_rate 178.0 12.65 7.99 -6.69 1.712100e+02
income_inequality 69.0 35.20 33.90 24.10 5.480000e+01

Conclusion

  • Higher GDP per capita is associated with higher life expectancy, with diminishing returns at high incomes.
  • Inequality may relate to health outcomes, but patterns vary by country.
  • Summary statistics provide context for typical ranges across countries.

Data source: (World Bank 2026)

Preston, Samuel H. 1975. “The Changing Relation Between Mortality and Level of Economic Development.” Population Studies 29 (2): 231–48.
World Bank. 2026. “World Development Indicators.” World Bank Open Data.